Monthly Reports
How to configure monthly reports?
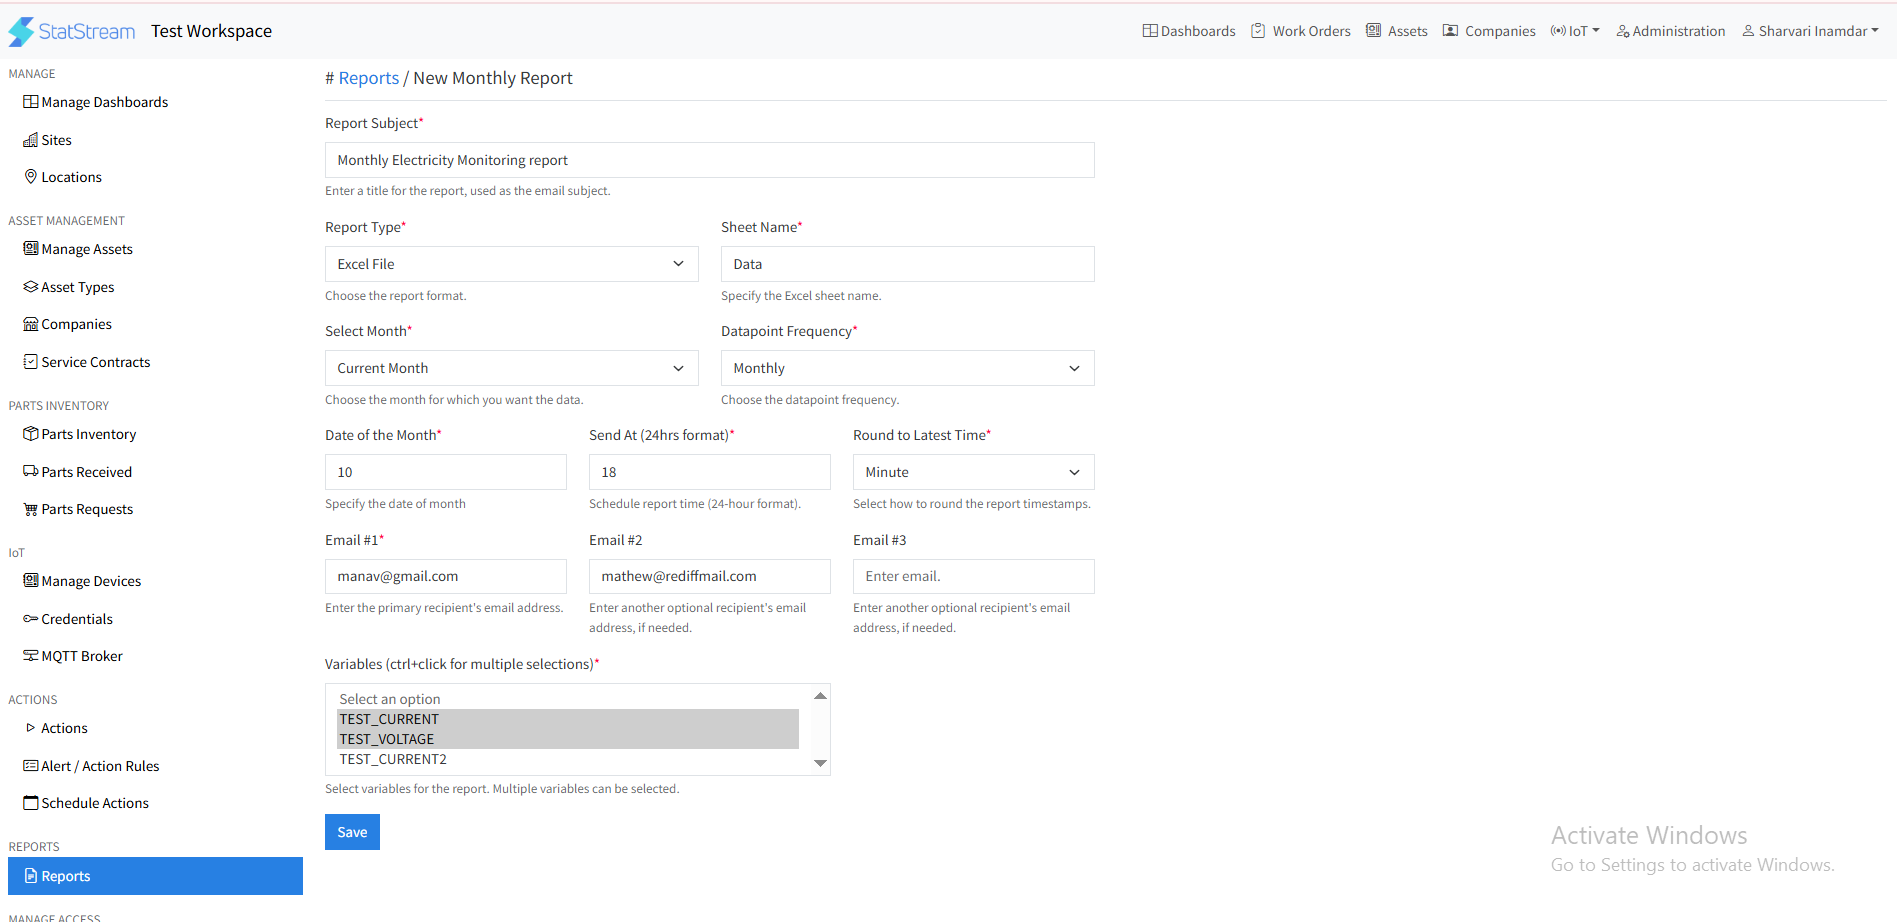
Monthly StatStream reports provide a regular, Excel-based summary of key parameters for informed decision-making.
- You can also upload your custom excel template file to schedule the reports.
-
Click on the Administration tab on top right corner.
-
From the left side panel, click on Reports.
-
Click New Report button on the top right corner, then click on Monthly Report.
-
Enter suitable Report Subject for your Report. Select Report type as Excel and sheet name as Data (this is where your data will get imported).
-
Select the Month for which you want to want the data for your report.
-
Select the Datapoint Frequency (choose how often your continuous data is summarized in the monthly report) as Hourly, Weekly, and Monthly.
-
Select the Date of the Month and the time as Send At (24 hour format) at which you want to receive the data.
-
For the Round to Latest Time, data points will be aligned to the nearest minute or second within your chosen hourly, weekly, or monthly datapoint frequency. Choose disable for no rounding.
-
Enter email address/s of the required users/members. Reports will be sent to these emails.
-
Select the required Variables from the dropdown list to send in reports.
Note: You can select multiple variables from the list.
-
Click on the Save button.
Note- All reports will have "Epoch Timestamp".
-
Refer to the below formula to convert epoch time to dd-mm-yyyy hh:mm format in your excel file:
-
=IF(data!A2="","",((data!A2+19800000)/86400000)+DATE(1970,1,1)) - This formula helps you to convert epoch time to standard date/time format in IST timezone (dd-mm-yyyy hh:mm).
-
=IF(data!B1="","",data!B1) , =IF(data!C1="","",data!C1) and so on (as per the count of your parameters columns in excel sheet will increase)- This formula helps you to copy your raw values from "data" sheet to your "Final report" sheet.
-