Dashboards
What is a Dashboard?
- Dashboards in StatStr helps your team to stay on the same page.
- You can add multiple widgets in your dashboard and get a hold of your critical business metrics.
- From tracking your Shopify sales volume to your Dev team activities, from critical support tickets to important deals getting closed. Drag what you want to track in a dashboard.
- You can also create multiple dashboards to keep your business indicators organized and easy to visualize.
How to create Dashboards?
- Login to your StatStr account.
- Go inside your workspace.
- Click on Dashboards from top right side.
Note
You will have a default dashboard already created within your workspace once you signup for StatStr, you can start adding widgets within the default dashboard or create your own dashboard from scratch.
-
Toggle on the Edit button to add a widget under a default dashboard. Now click on Add Widgets button on the right.
-
You will now see a list of our pre-baked widgets for each data source integration.
-
Search your desired widget from the widget list and click on Add to Dashboard button.
-
Once you have added all the required widgets, click the Save button and toggle off the Edit button to exit the edit mode.
-
You can create multiple dashboards in StatStr
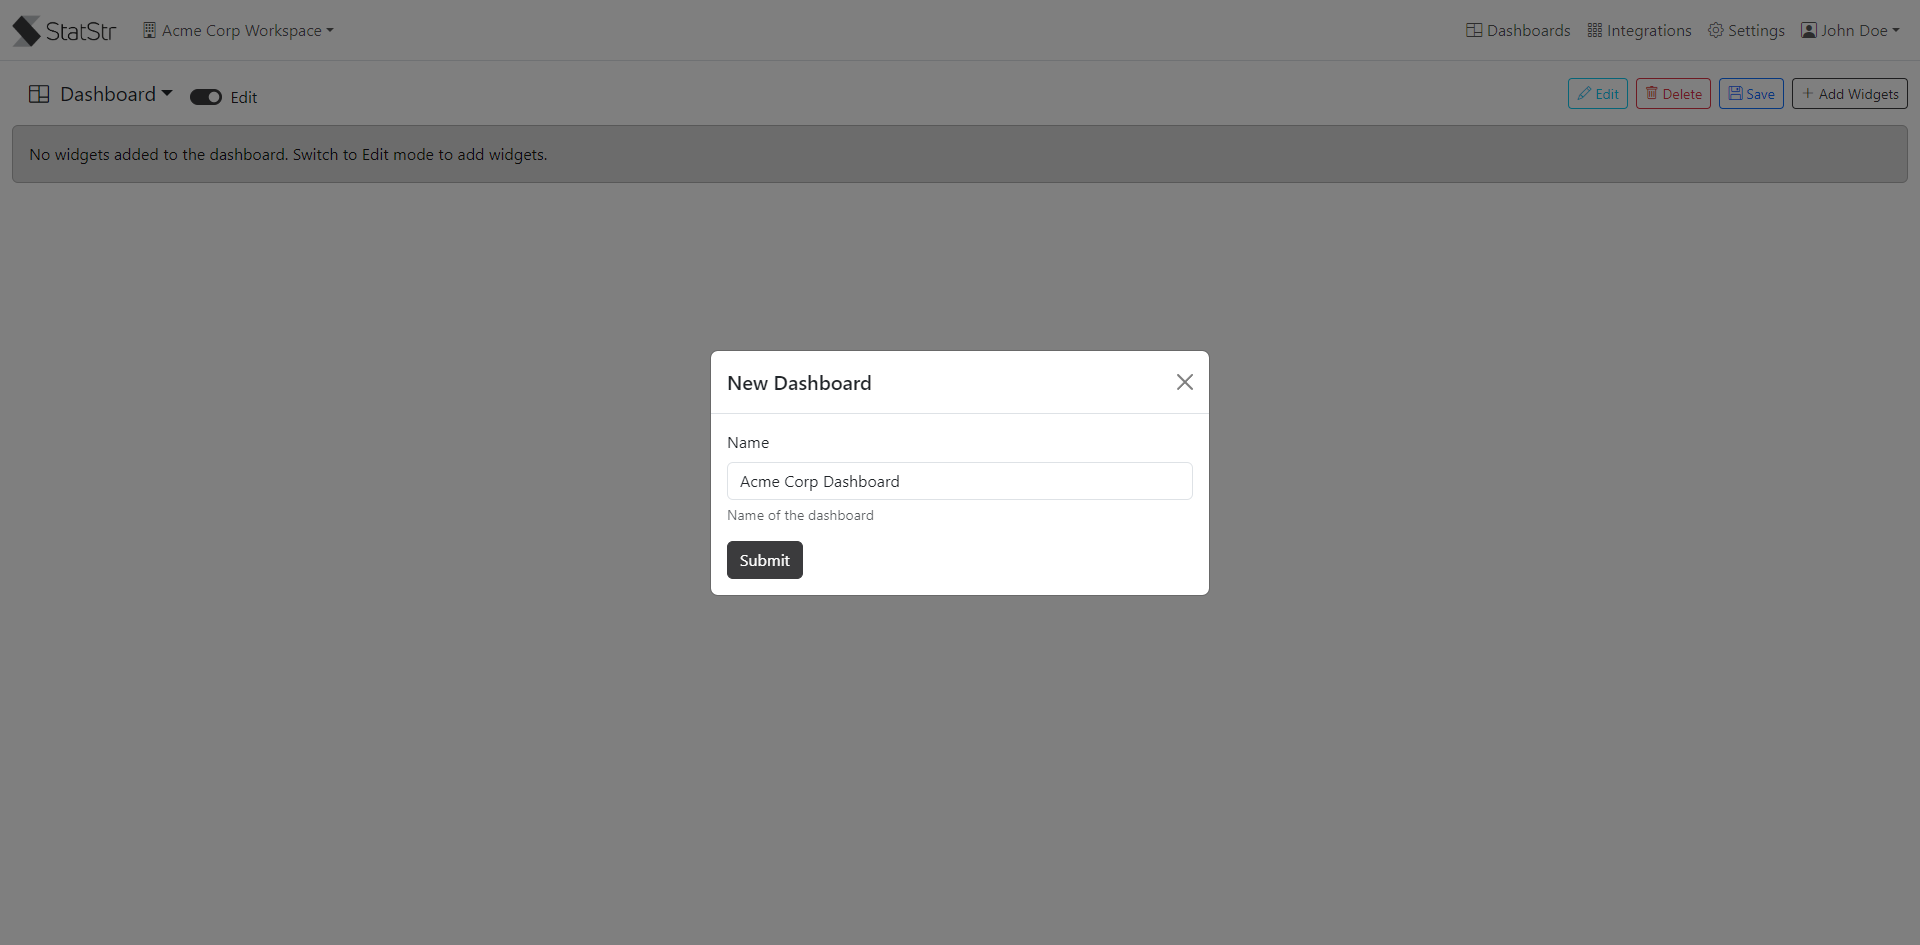
- Click on the Dashboards dropdown button on the left and then click on New Dashboard option.
- Give your dashboard a suitable name and click the Submit button.
- Toggle on the Edit button and start adding widgets under it.
- Voila! you have now successfully created a dashboard. Invite your team members and start collaborating and keep everyone of the same page.